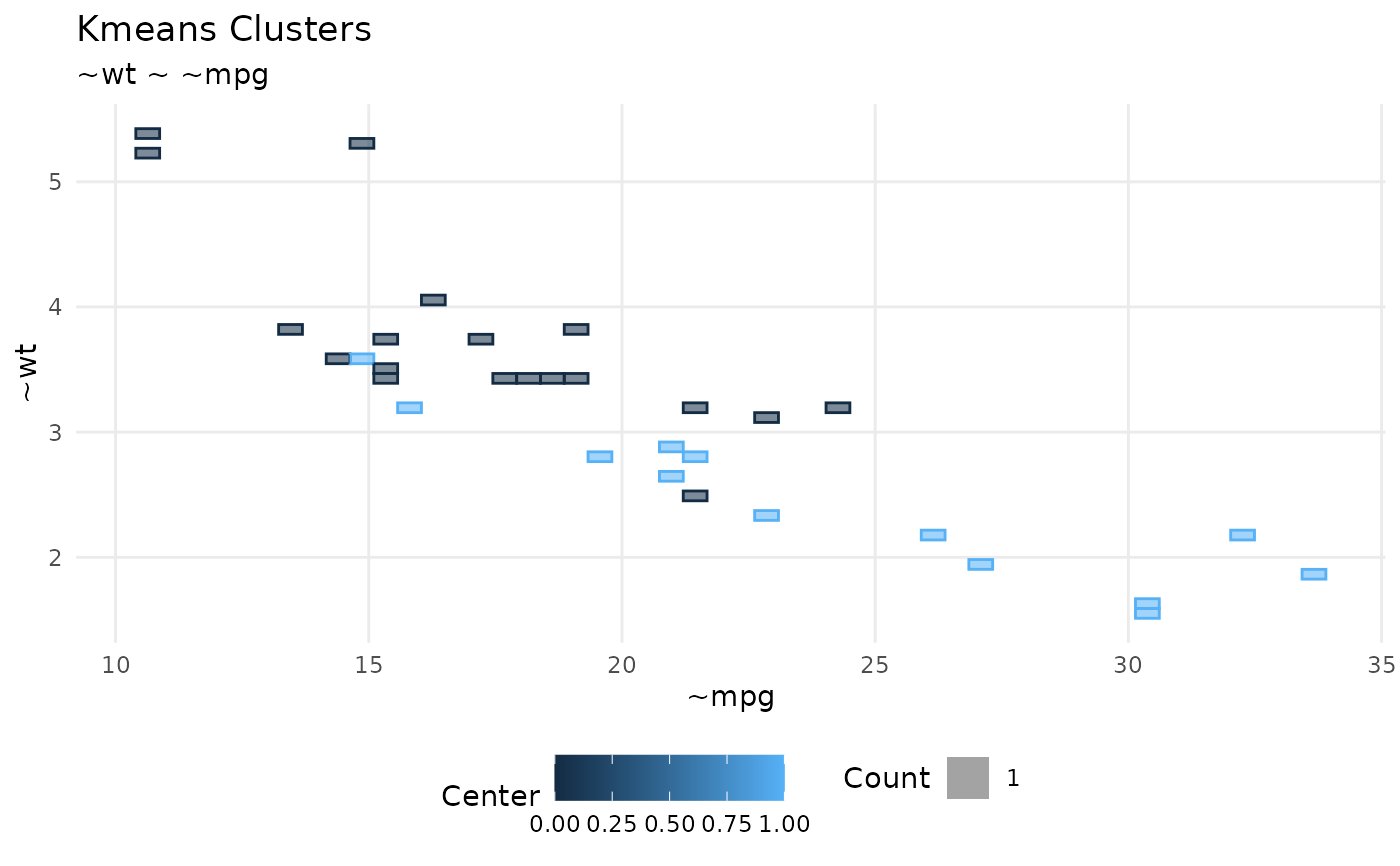
It uses 'ggplot2' to display the results of a KMeans routine. Instead of a scatterplot, it uses a square grid that displays the concentration of intersections per square. The number of squares in the grid can be customized for more or less fine grain.
Usage
plot_kmeans(df, x, y, resolution = 50, group = center)

db_calculate_squares(df, x, y, group, resolution = 50)
Arguments
- df
A Local or remote data frame with results of KMeans clustering
- x
A numeric variable for the x axis
- y
A numeric variable for the y axis
- resolution
The number of squares in the grid. Defaults to 50. Meaning a 50 x 50 grid.
- group
A discrete variable containing the grouping for the KMeans. It defaults to 'center'
Details
For large result-sets in remote sources, downloading every intersection will be a long running, costly operation. The approach of this function is to devide the x and y plane in a grid and have the remote source figure the total number of intersections, returned as a single number. This reduces the granularity of the visualization, but it speeds up the results.